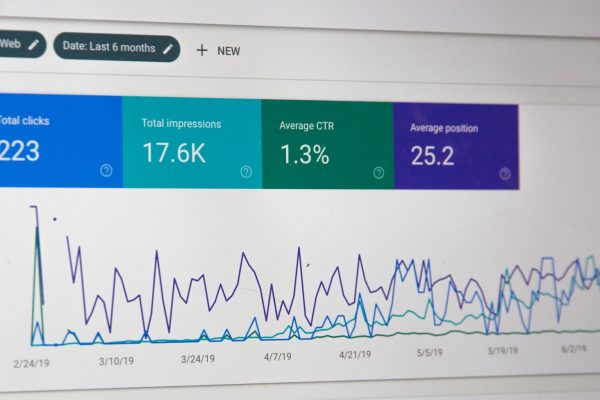
In today’s competitive market, data-driven insights are no longer optional; they are essential for growth and sustainability. For small and medium-sized businesses, leveraging predictive analytics can seem daunting. However, you don’t need a massive IT budget or a team of data scientists to start using predictive insights effectively. Here’s a unique, step-by-step tutorial to help you unlock the potential of your data:
Step 1: Define Your Business Goals
Before diving into data, it’s essential to identify what you want to achieve with predictive insights.
Examples of Goals:
- Reduce customer churn by identifying at-risk customers.
- Improve inventory management by forecasting demand trends.
- Optimize marketing campaigns by predicting customer behavior.
- Write down your goals in measurable terms (e.g., “Reduce churn by 15% within 6 months”).
Step 2: Identify Relevant Data Sources
You likely already collect valuable data, but it’s important to ensure the data aligns with your goals.
Common Data Sources for Small Businesses:
- Customer relationship management (CRM) tools.
- Point-of-sale (POS) systems.
- Website analytics platforms (e.g., Google Analytics).
- Social media metrics.
- Employee performance or productivity tools.
- Consolidate your data into a single repository using tools like Google Sheets, Airtable, or a dedicated data visualization platform.
Step 3: Clean and Organize Your Data
Raw data can often be messy and incomplete, which can distort predictive insights.
Data Cleaning Checklist:
- Remove duplicate entries.
- Fill in missing values (e.g., using averages or estimations).
- Standardize formats (e.g., dates, currencies).
- Validate data accuracy by cross-referencing with original sources.
Step 4: Choose Simple Predictive Tools
You don’t need advanced coding skills or expensive software to start predictive analytics. Here are user-friendly tools:
No-Code Platforms:
- Microsoft Excel: Use built-in forecasting tools and pivot tables.
- Google Sheets: Leverage the “TREND” or “FORECAST” functions.
- Tableau: Visualize trends and patterns in your data.
- Power BI: Combine data sources and create interactive dashboards.
- Explore affordable AI-powered platforms like MonkeyLearn or RapidMiner for more advanced needs.
Step 5: Perform Exploratory Data Analysis (EDA)
Understanding your data is crucial before making predictions.
Key Techniques for EDA:
- Create visualizations like histograms, line charts, or scatter plots to spot trends.
- Analyze correlations between variables using heatmaps.
- Look for seasonality or patterns over time.
- Tools like Tableau or Power BI can make this step intuitive and visually engaging.
Step 6: Build a Predictive Model
Now it’s time to forecast outcomes based on historical data.
Basic Predictive Models for Beginners:
- Regression Analysis: Predict a numerical outcome (e.g., sales revenue) based on input variables.
- Classification Models: Categorize data (e.g., identifying customers likely to churn).
- Many tools like Excel and Google Sheets have regression analysis add-ons, making this step accessible.
Step 7: Test Your Predictions
Predictions are only useful if they are accurate. Validate your model by testing it with a subset of data.
Validation Steps:
- Split your data into training (70%) and testing (30%) sets.
- Measure your model’s accuracy using metrics like Mean Absolute Error (MAE) or accuracy scores.
- Adjust your model if predictions are consistently off-target.
Step 8: Apply Predictions to Decision-Making
Put your predictive insights into action by integrating them into your operations.
Examples of Applications:
- Create personalized marketing campaigns based on predicted customer preferences.
- Stock products based on demand forecasts to reduce overstock or shortages.
- Allocate resources to employees or departments predicted to have the highest impact.
Step 9: Monitor and Iterate
Predictive analytics is not a one-and-done process. Regularly revisit your models and data to improve accuracy.
Regular Monitoring Tips:
- Schedule monthly reviews of your predictions against actual outcomes.
- Collect new data to refine your model.
- Stay updated on industry trends that could influence your variables.
Step 10: Share Insights Effectively
The value of predictive analytics increases when it’s shared with the right people.
Communication Best Practices:
- Use dashboards to present predictions visually.
- Tailor insights to specific audiences (e.g., sales teams, marketing departments).
- Highlight actionable takeaways instead of overwhelming stakeholders with raw data.
Final Thoughts
Predictive analytics can transform your small business by offering actionable insights that drive smarter decisions. By starting small and using the tools and steps outlined here, you can demystify the process and unlock opportunities hidden within your data. In a world where data is power, will your business take the lead or fall behind?


