Small business owners often think “insights” means expensive analytics tools and corporate-level reports. In reality, some of your most powerful insights are already in the information you have. This can be sales receipts, customer chats, or inventory notes. It is just that you may not have been turning them into actionable steps.
This tutorial walks you through how to collect, organize, and interpret your everyday business data so you can make decisions with confidence.
Step 1: Decide the Question You Want to Answer
Before you dive into numbers, define your goal. A vague “I want to grow” won’t get you far. A specific question will.
Examples:
- “Which products should I stop stocking?”
- “What time of day do I make the most sales?”
- “Which marketing channel brings the customers who spend the most?”
Pro Tip: Clear questions give you a clear path to the right data.
Step 2: Collect Data You Already Have (Don’t Overcomplicate It)
You don’t need fancy systems. Start with what’s available:
- Sales receipts or POS reports.
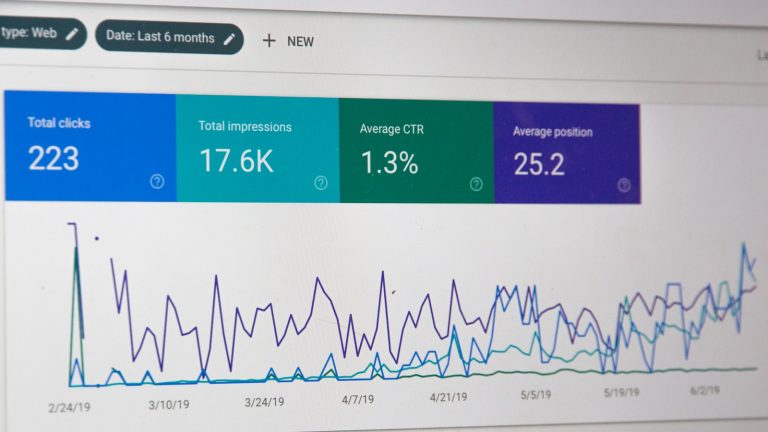
- Online store analytics (Shopify, Etsy, WooCommerce dashboards).
- Social media engagement metrics (Facebook Insights, Instagram Insights).
- Customer feedback from reviews, messages, and in-person comments.
Even one month of consistent data can show patterns.
Step 3: Organize It for Visibility
Dumping numbers into a spreadsheet is one thing, and organizing them so they tell a story is another.
- Create a simple table: Date, Product/Service, Quantity Sold, Sale Value, Source of Customer.
- Color code or highlight high and low performers.
- Group similar items (e.g., “Seasonal products” vs “Year-round products”).
If you prefer visual tools, Google Data Studio or Canva charts can help and both are free.
Step 4: Look for Patterns, Not Just Numbers
Patterns are where insights hide. Ask yourself:
- Do certain products sell better on weekends?
- Does Instagram bring fewer customers but higher spenders?
- Does a price point consistently convert better?
Example:
A small candle business notices that even though Instagram brings fewer visitors than Facebook, those visitors spend 40% more per order. That insight shifts ad spend to Instagram.
Step 5: Test a Small Change Based on the Insight
An insight is only valuable if it leads to action.
- If morning sales are weak, run a morning-only promotion.
- If a product is slow-moving, bundle it with a bestseller.
- If repeat customers spend more, create a loyalty perk to encourage more repeats.
Keep the change small at first so you can measure the impact without risking too much.
Step 6: Measure and Decide Your Next Move
After testing:
- Compare results to your baseline.
- Keep what worked, tweak what didn’t, and drop what flopped.
- Repeat the process every month or quarter.
This creates a cycle of improvement where your business gets sharper over time.
Common Mistakes to Avoid
Drowning in data with no purpose. Always start with a question.
Chasing vanity metrics. Likes and follows are nice, but if they don’t lead to sales, they’re a distraction.
Making big changes in one month’s data. Always confirm trends over time before major shifts.
Closing Thought
Insights aren’t reserved for big companies with data teams. They’re the competitive advantage of any business owner willing to look closely, think critically, and test consistently.
The maturity of your insight process is often what separates a business that “gets by” from one that scales with intention.